
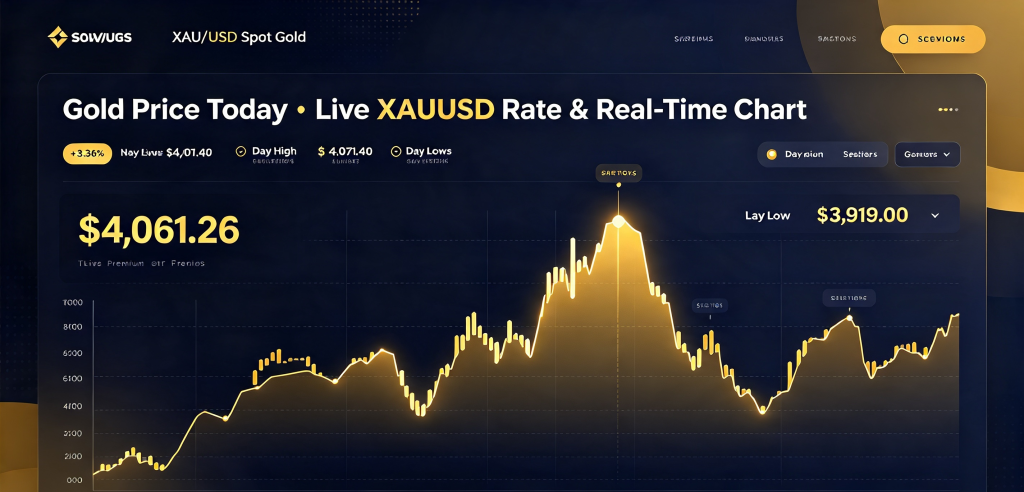
Updated: 4 November 2026 · mptrading.uk
Replace with your AdSense code in functions.php or via filter
Current XAUUSD Snapshot
As of 20:44 UTC, 4 November 2026:
Table
| Metric | Value |
|---|---|
| Spot Gold Price (XAUUSD) | $4,061.26 per troy ounce |
| Today’s Change | +$132.20 (+3.36%) |
| Day’s Range | $3,919.00 – $4,071.40 |
| Open / Previous Close | $3,935.98 / $3,935.98 |
| 52-Week Range | ~$3,870 – $4,149.41 |
| Gold in GBP | £3,016.26 per ounce |
| Gold in EUR | €3,619.29 per ounce |
Prices are delayed by up to 15 minutes. For real-time execution, always verify with your broker’s live feed.
What Is XAUUSD?
XAUUSD is the standard market symbol representing the spot price of one troy ounce of gold quoted in US dollars. It is the most widely traded precious metals instrument in the world — tracked by central banks, institutional investors, and retail traders alike. Unlike a stock or currency pair backed by an economy, gold is a timeless store of value — with no counterparty risk, no earnings reports, and no expiration date.
The code breakdown is simple:
- XAU = ISO 4217 currency code for gold (from the chemical symbol Au)
- USD = United States Dollar
- Together, they tell you how many US dollars you need to buy one ounce of physical gold in the global wholesale market.
How to Read the Real-Time Chart
A live XAUUSD chart does more than show a number — it reveals market behaviour. Here is what you are actually seeing:
Price Action & Timeframes
- Tick / 1-Minute Chart — best for scalping; shows every price movement as it happens. Spikes here often align with news releases.
- Hourly / 4-Hour Chart — balances detail with clarity; ideal for swing trading and identifying intraday trends.
- Daily / Weekly Chart — filters out daily noise; reveals the dominant long-term trend driven by macroeconomics.
Key Levels to Watch
- Support — price zone where buying historically overwhelms selling; a floor that tends to hold.
- Resistance — price ceiling where sellers step in; breaking it signals strong momentum.
- Round Numbers — psychological levels like $4,000, $4,050, $4,100 act as natural magnets and reversal points.
- Previous High / Low — the most reliable reference points for judging whether momentum is shifting.
Volume & Volatility Clues
- Rising price on rising volume = stronger, more sustainable move.
- Rising price on shrinking volume = weakening trend; watch for reversal.
- Gold typically trades most actively during London and New York overlap (14:30–17:00 UTC) — spreads are tightest and movement strongest.
What Drives Gold Right Now (November 2026)
Gold has surged to multi-week highs, and these are the forces in play:
1. US Dollar Strength or Weakness
Gold and the US dollar share an inverse relationship: when the dollar falls, gold rises — and vice versa. Because gold is priced in USD, a weaker dollar makes it cheaper for buyers using other currencies, boosting demand. Currently, dollar softness following Federal Reserve communication is lifting XAUUSD.
2. Interest Rates & Real Yields
Gold pays no interest or dividends. When bond yields rise, gold becomes relatively less attractive compared to fixed-income assets. The critical measure is real yields — nominal interest rates minus inflation. Falling or negative real yields are historically the most bullish environment for gold. Markets are currently pricing in potential rate cuts, supporting higher prices.
3. Inflation & Economic Uncertainty
Gold is the original inflation hedge. When purchasing power of fiat currency erodes, investors turn to gold to preserve wealth. Geopolitical tensions, trade disputes, or banking system instability also trigger “flight-to-safety” demand — pushing XAUUSD higher regardless of other drivers.
4. Central Bank Buying
In recent years, central banks — particularly emerging-market nations — have purchased gold at record paces to diversify reserves away from USD. This structural demand underpins long-term support levels.
How to Use This Data — For Traders & Investors
For Short-Term Traders
- Check the chart 30 minutes before major news: Fed decisions, NFP, CPI inflation data. Spreads widen and volatility spikes — plan your entry and stop-loss before the release.
- Focus on London–New York overlap (14:30–17:00 UTC) for the cleanest moves and lowest execution costs.
- Always define risk: 1–2% of your account per trade is the golden rule. Gold can move $30–$50 in minutes during news events.
For Long-Term Investors
- Ignore daily noise — focus on weekly and monthly trends. The broader trajectory has been upward as gold establishes new all-time highs.
- Consider accumulation on pullbacks rather than chasing price spikes.
- Allocation guideline: 5–10% of a balanced portfolio in gold acts as effective insurance against market shocks.
Where to Access Live Charts
- TradingView — free, highly customisable; the industry standard
- MetaTrader 5 (MT5) — integrates directly with your broker; ideal if you trade from the same platform
- Kitco / BullionVault — reference prices; excellent for long-term tracking but not for execution
Common Misconceptions
- ❌ “Gold always goes up in a crisis” — Not always. In a liquidity crunch, investors may sell everything including gold to raise cash. Context matters.
- ❌ “Higher inflation = higher gold” — Only if inflation exceeds interest rates. If rates rise faster than inflation, gold can fall.
- ❌ “I need a lot of money to trade it” — CFDs allow fractional position sizing; you can start with very small capital. Just remember: leverage magnifies losses as well as gains.
Summary
Gold at $4,061.26/oz is in a strong upward phase as of early November 2026. The real-time XAUUSD chart is more than a price feed — it is a window into global confidence, currency strength, and risk appetite. Whether you are day-trading swings or building long-term wealth, the key is the same: know what moves the price, define your levels, and protect your capital. Gold has preserved value for millennia — but trading it requires discipline every single day.
Disclaimer: This article is for informational purposes only and does not constitute financial advice. Always conduct your own research before trading or investing. Past performance is not indicative of future results.

Leave a Reply