
Introduction
Gold has entered a transformative era. After breaking through long-standing resistance levels and repeatedly setting fresh all-time highs, the precious metal is no longer viewed merely as a crisis hedge — it has become a strategic reserve asset, a portfolio diversifier, and a barometer of global confidence in fiat currency. What does the future hold? This forecast examines the price trajectory from now through 2030, drawing on institutional research, macroeconomic modelling, and structural market shifts that are reshaping the gold landscape.
Replace with your AdSense code in functions.php or via filter
2026: The Year of Consolidation & New Highs
As of late 2026, gold has traded in a broad range between approximately $3,900 and $4,650 per troy ounce, with periodic spikes driven by Federal Reserve policy shifts and geopolitical developments. Leading institutions offer these year-end projections:
Table
| Institution | 2026 Year-End Target | Key Assumption |
|---|---|---|
| Goldman Sachs | $4,650 | Sustained central bank buying + Fed rate cuts |
| Bank of America | $4,250 – $4,500 | Gradual easing, sticky inflation |
| LBMA Survey (Consensus) | $4,400 – $4,700 | Geopolitical fragmentation + de-dollarisation flows |
What to expect in H2 2026:
- Pullbacks toward $4,100–$4,200 are likely during periods of dollar strength or hawkish Fed commentary
- A decisive close above $4,600** opens a path toward **$4,800–$5,000 by year-end
- The dominant trend remains upward — corrections are buying opportunities unless structural drivers reverse
2027–2028: The Structural Bull Market Matures
These two years will be defined by institutional rebalancing and supply constraints:
- Portfolio allocation shift: Pension funds and asset managers raising gold from 1–2% to 3–5% of portfolios creates sustained multi-billion-dollar inflows
- Central bank accumulation: BRICS and emerging-market nations continue purchasing to diversify away from USD; no near-term reduction in pace is visible
- Supply limits: New mining projects take 5–10 years to commission; annual output growth remains capped at 1–2% even at elevated prices
- Price range forecast: $4,500 – $5,500, with average levels settling around $4,800–$5,000
Key risk: If inflation falls sharply and the Fed returns to aggressive tightening, real yields could rise and cap gains — but this scenario is increasingly viewed as unlikely by late 2026.
2029–2030: De-Dollarisation & Long-Term Equilibrium
By the end of the decade, the gold market will have fundamentally changed. The price will reflect not just interest-rate cycles but a permanent revaluation of the global monetary system:
- De-dollarisation momentum: The share of global reserves held in USD continues declining; gold is the primary neutral alternative
- Currency debasement: Debt-to-GDP ratios across developed economies exceed 120% on average; financial repression (negative real rates) becomes standard policy
- Industrial demand explosion: Gold’s role in green technology — hydrogen fuel cells, advanced electronics, medical devices — grows significantly, adding a non-traditional demand pillar
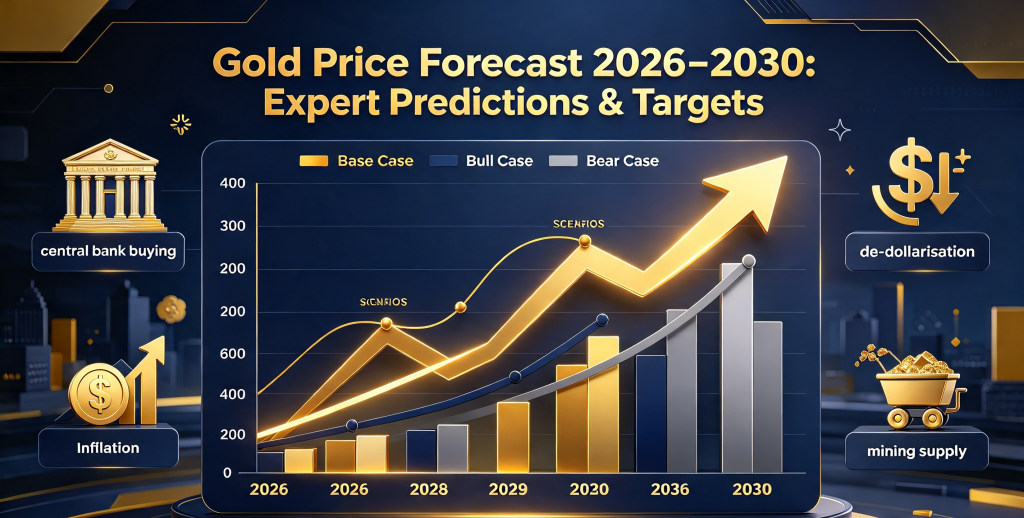
- 2030 Price consensus:
- Base case: $5,000 – $6,000 per ounce
- Bull case: $6,500 – $8,000 (significant monetary instability or major conflict)
- Bear case: $4,000 – $4,500 (global deflationary crash + aggressive Fed tightening)
How to Position — For Traders & Investors
Short-Term (0–6 Months)
- Buy pullbacks toward $4,100–$4,200 with stops below $3,950
- Take partial profits near $4,550–$4,600 before major news events
- Watch Fed communications and CPI releases — these trigger the largest intraday moves
Medium-Term (6–24 Months)
- Accumulate on any dip below $4,300 — the structural backdrop supports higher prices
- Consider dollar-cost averaging rather than chasing spikes
- Maintain exposure through a mix of spot/ETF holdings and tactical trading positions
Long-Term (2028–2030)
- Target allocation: 5–10% of a balanced portfolio
- Focus on physical gold or low-premium ETFs; avoid overpaying for numismatic items
- Revisit targets annually — if central bank buying slows or supply surges, adjust accordingly
Critical Risks to This Outlook
Table
| Risk | Impact on Gold | Probability |
|---|---|---|
| Fed keeps rates high through 2027 | Bearish — stronger dollar, higher real yields | Medium |
| Geopolitical de-escalation | Mildly bearish — reduced safe-haven flows | Low–Medium |
| Global recession / liquidity crunch | Mixed — initial sell-off for cash, then recovery | Medium |
| Major new gold discoveries | Mildly bearish long-term; no near-term projects of scale | Very Low |
Final Summary
Gold’s rally is not a temporary surge — it is a re-pricing driven by permanent shifts in the global monetary order. The decade ahead will see gold establish new reference levels, with the $5,000 threshold likely broken between late 2027 and mid-2028**, and prices ranging between **$5,000 and $6,000 by 2030 in the base case. Volatility will persist — pullbacks of 5–10% in a month are normal — but the trend is structurally higher.
Disclaimer: Forecasts are not guarantees. Markets can and do shift course — always manage risk and diversify beyond any single asset class.


Leave a Reply