

Where will the Dow Jones — the US30 — be in one year? In five years? No forecast is perfect, but by combining historical growth rates, institutional consensus, earnings models, and structural drivers, we can build a realistic range of outcomes. This guide presents balanced projections for 2026 through 2030, including base, bull, and bear scenarios, and explains the assumptions behind each number.
Replace with your AdSense code in functions.php or via filter
Current Context
As of November 2026, the Dow sits near 53,000, having crossed the historic 50,000 milestone in February 2026 and reached an all-time high above 54,700 in August. The index has delivered approximately 7–9% annualised returns over the long term, though individual years vary dramatically.
Consensus Forecast by Year
Table
| Year | Base Case | Bull Case | Bear Case | Key Assumption |
|---|---|---|---|---|
| End 2026 | 52,000 – 54,500 | 55,000 – 56,000 | 48,000 – 50,000 | Fed rate path; earnings growth 8–12% |
| 2027 | 55,000 – 58,000 | 60,000+ | 50,000 – 52,000 | First full year of Fed easing cycle; AI productivity gains broadening |
| 2028 | 58,000 – 61,000 | 63,000 – 65,000 | 52,000 – 54,000 | Capital expenditure cycle matures; mid-term election volatility fades |
| 2029 | 61,000 – 64,500 | 67,000 – 70,000 | 54,000 – 56,000 | Earnings compound at historical average; valuations stabilise |
| 2030 | 64,000 – 68,000 | 70,000 – 73,000+ | 56,000 – 59,000 | Long-term ~5–7% annual growth trajectory |
What Drives These Numbers?
Bull Case: 70,000+ by 2030
- AI-driven productivity surge boosts corporate margins across the Dow’s industrial and tech constituents
- Inflation cools steadily; Fed cuts rates to 3.0–3.5% range, lowering borrowing costs
- Fiscal policy supports growth without triggering new debt fears
- Dow rebalances to include more high-growth companies, lifting the index’s growth profile
Base Case: 64,000–68,000 by 2030
- Returns track the long-term average of ~5–7% annually
- Occasional 10–15% pullbacks occur along the way — normal and healthy
- Earnings grow at roughly 8–10% per year; valuations remain near historical averages
- The index compounds steadily rather than exploding upward
Bear Case: 56,000–59,000 by 2030
- Recession hits; corporate earnings contract 10–15%
- Geopolitical fragmentation disrupts global supply chains and trade
- Interest rates remain elevated for years; debt servicing costs crowd out investment
- The index trades sideways for a period — delivering dividends but muted price gains
Critical Observations
No Straight Lines Upward
Even in strong bull markets, the Dow typically experiences at least one 8–12% pullback per year. The path from 53,000 to 65,000 will not be smooth — expect corrections, volatility around elections, and reactions to every major economic data release. The long-term trend is upward, but the ride is rarely calm.
The Dow Is Not the Whole Market
Because it is price-weighted and limited to 30 stocks, the Dow can diverge from the broader S&P 500. In periods dominated by mega-cap tech, the Dow may lag; in rotations toward value, industrials, and financials, it can outperform. Diversifying beyond a single index remains prudent.
Milestones Are Psychological, Not Mechanical
Crossing 50,000, then 60,000, then 70,000 grabs headlines and boosts confidence — but the underlying fundamentals matter more than the round number itself. Buying simply because a milestone was crossed is rarely a good strategy.
For Traders vs Investors
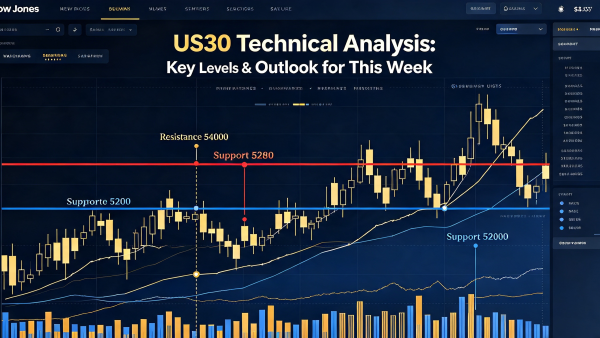
- Traders: Focus on the near-term ranges — 52,000 support and 54,700 resistance. The forecast is directional context, not a daily signal.
- Investors: Pullbacks toward 50,000–51,000 are historically accumulation zones. The 2030 target is a destination, not a deadline — consistency and regular contributions matter more than timing the exact bottom.
Disclaimer: Forecasts are estimates, not guarantees. Markets can and do surprise to both the upside and downside.


Leave a Reply