
chnical analysis is the art of reading price behaviour to identify where the market has been, where it might be heading, and — most importantly — where the high-probability decision points lie. For the US30 (Dow Jones Industrial Average), certain levels act as magnets, barriers, and pivots that repeat reliably across timeframes. Here is the structured technical outlook and key levels to watch this week.
Replace with your AdSense code in functions.php or via filter
Current Market Structure
As of early November 2026, the US30 remains in a broader uptrend, having established higher highs and higher lows through much of the year. The index reached its all-time high near 54,744 in August 2026, then consolidated and pulled back before finding support and grinding higher. Momentum is positive but showing signs of cooling near recent peaks — a classic consolidation phase before the next directional move.
Key Price Levels to Watch
Table
| Level Type | Price Zone | Significance |
|---|---|---|
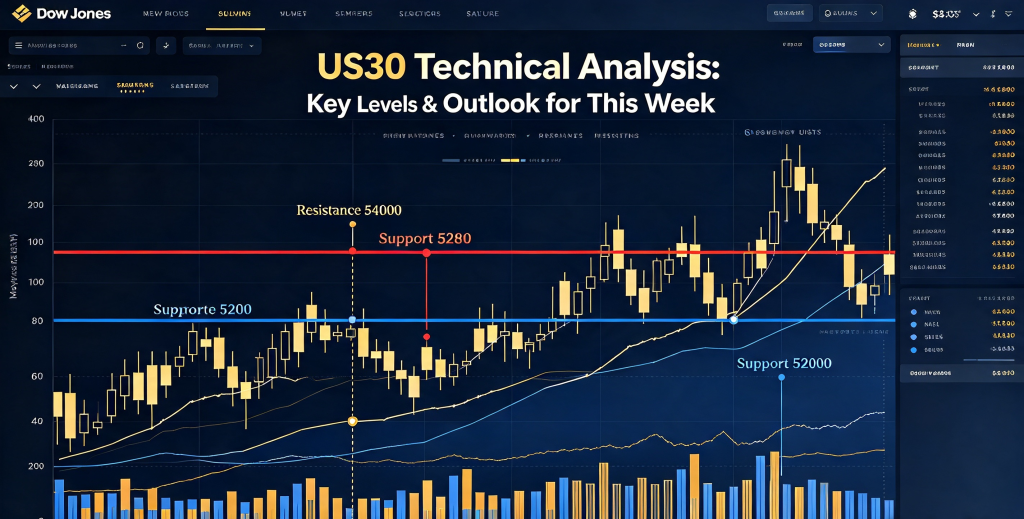
| Immediate Resistance (R1) | 53,800 – 54,000 | Recent supply zone; a close above this confirms renewed buying momentum toward the ATH |
| Major Resistance (R2) | 54,500 – 54,744 | All-time high zone; historic barrier where sellers emerged in August |
| Immediate Support (S1) | 52,800 – 53,000 | Recent swing area; breaking this signals a deeper correction toward 52,000 |
| Major Support (S2) | 51,800 – 52,000 | Psychological level + previous consolidation zone; critical line in the sand for the uptrend |
| Secondary Support | 50,500 – 50,800 | Strong demand zone tested in October; holding here keeps the bullish structure intact |
Indicator & Momentum Picture
- 20-Day Moving Average: Currently near 53,100. Price holding above it confirms short-term bullish bias; a break below signals weakening momentum.
- 50-Day Moving Average: Near 52,400 — aligns with the secondary support zone. This is the line many institutional traders use to define trend health.
- RSI (Relative Strength Index): Around 58–62. Not yet overbought, but approaching the upper end of the neutral range. A reading above 70 would indicate near-term exhaustion; below 50 signals shifting momentum.
- Volume Analysis: Recent rallies have seen decent participation, but volume thinned near resistance — suggesting conviction is still building on the breakout attempt.
Bullish Scenario
- A daily close above 54,000 with expanding volume opens a retest of the all-time high at 54,744.
- If that level is breached, new targets emerge around 55,200–55,500 (extension levels).
- Confirmation: Wait for the pullback after the breakout to hold above 53,500 before seeking long entries.
Bearish Scenario
- Failure at 54,000 followed by a break below 52,800 signals a deeper correction toward 52,000.
- Losing 52,000 on a weekly close would invalidate the short-term uptrend and open a move toward 50,500–50,800.
- This is not necessarily a reversal of the multi-year trend — just a healthy pullback that creates fresh buying opportunities later.
Neutral / Range-Bound Outlook
The most likely immediate path is consolidation between 52,800 support and 54,000 resistance as markets digest recent gains and await catalysts: Fed communications, key earnings releases, and economic data. Range-bound conditions mean buying near support and taking profit near resistance works best — avoid chasing breakouts until confirmed by a daily close outside the zone.
Practical Trading Takeaways
- Session Timing: The strongest moves typically occur during the New York session (14:30–21:00 UTC). Pre-market often sets the tone, but the first hour of regular trading usually confirms direction.
- News Sensitivity: Watch inflation data and Fed speeches — these can instantly shift the technical picture. Have your levels mapped before the release, not during it.
- Round Numbers Matter: 53,000 and 54,000 act as psychological magnets. Price often pauses or reverses near these levels.
Disclaimer: Technical analysis identifies probabilities, not certainties. Past price patterns do not guarantee future results.



Leave a Reply