
Published: 5 November 2026 · mptrading.uk
Replace with your AdSense code in functions.php or via filter
Live Market Snapshot — US30 / Dow Jones
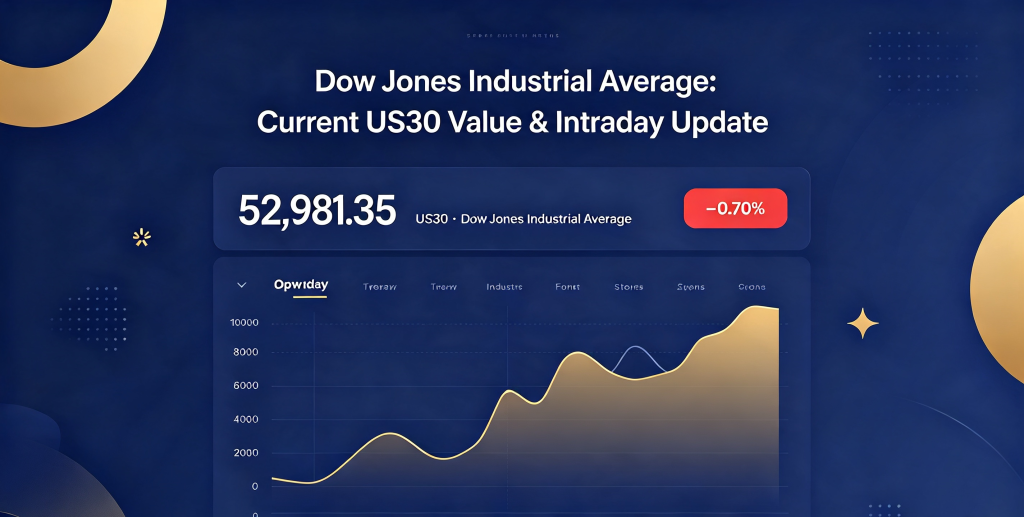
As of 17:45 UTC, 5 November 2026:
Table
| Metric | Value |
|---|---|
| US30 Current Level | 52,981.35 |
| Today’s Change | −374.77 points (−0.70%) |
| Day’s Trading Range | 52,973.13 – 53,710.61 |
| Opening Price | 53,679.01 |
| Previous Close | 53,356.12 |
| 52-Week Range | ~41,744 – 54,744 (All-Time High: 54,744.33 on 5 August 2026) |
| Volume (Intraday) | ~1.14 billion shares and rising |
Prices are delayed by up to 15 minutes. For live execution, always verify with your broker’s real-time feed.
What Is the US30 / Dow Jones Industrial Average?
The US30 — officially the Dow Jones Industrial Average (DJIA) — is the oldest and most recognisable stock market benchmark in the world, tracing its roots back to 1896. Unlike broader indices such as the S&P 500, the US30 tracks exactly 30 blue-chip companies handpicked to represent the health of the United States economy across all major sectors. These are not selected by rigid formula — they are chosen by the editors of The Wall Street Journal to reflect America’s corporate backbone.
The defining feature that makes the US30 unique — and often misunderstood — is its price-weighted methodology. Companies with higher share prices carry greater influence over the index’s movement, regardless of their total market value. This means a sharp move in a high-priced stock like Goldman Sachs, Caterpillar, or UnitedHealth can shift the US30 significantly more than the same percentage move in a lower-priced giant.
Sector Breakdown (November 2026)
Table
| Sector | Weight |
|---|---|
| Financials | ~23–27% |
| Information Technology | ~18–19% |
| Healthcare | ~15–18% |
| Industrials | ~13–14% |
| Consumer Discretionary | ~9–15% |
| All Others | ~10% |
Alphabet (GOOGL) joined the index on 29 June 2026, replacing Verizon Communications — a recent refresh that strengthens the tech representation within the Dow.
Intraday Price Action — What Happened Today?
The US30 opened near its session high at 53,679.01 but has trended downward through the London–New York transition, falling to 52,981.35 — a drop of roughly 0.70% on the day. Key observations:
- Resistance tested: The 53,700 zone acted as firm overhead supply early in the session. Buyers failed to break through, triggering profit-taking.
- Support holding: The 52,970–53,000 floor has held so far — a break below 52,970 would likely signal deeper retracement toward 52,500.
- Volatility elevated: The intraday range of roughly 737 points reflects heightened sensitivity to macroeconomic data and Federal Reserve commentary.
- Sector divergence: Financials and healthcare show relative resilience, while select technology and consumer discretionary names lag.
What Drives the US30 Right Now
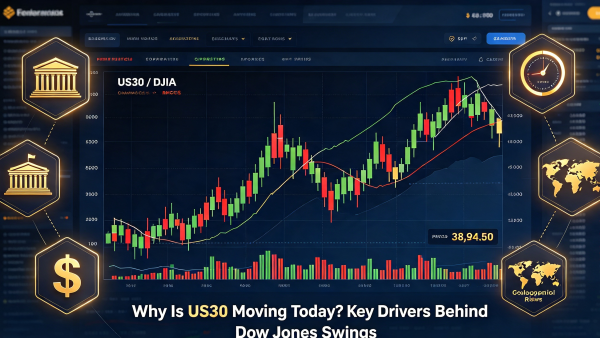
These are the primary forces steering the Dow in November 2026:
1. Federal Reserve Policy Expectations
The US30 has rallied strongly through 2026, driven in large part by market pricing in potential interest rate cuts. Any pushback from Fed officials — or hotter-than-expected inflation data — can unwind those expectations and pressure the index. The relationship is clear: lower rates → cheaper capital → higher stock valuations.
2. Top-Heavy Influence
Because the US30 is price-weighted, its largest movers have outsized impact. Goldman Sachs, UnitedHealth Group, Microsoft, Caterpillar, and Home Depot collectively account for nearly half the index’s movement. When these giants stumble, the Dow follows.
3. Earnings Momentum & Guidance
We are in a period where quarterly results and forward guidance matter more than usual. Investors are scrutinising revenue growth and margin health — if bellwether Dow companies signal slower expansion, the index re-prices accordingly.
4. Geopolitical & Global Sentiment
Despite being a US-focused index, the Dow reacts to global events — trade developments, major policy shifts in China or Europe, and energy market volatility all flow through to US30 price action.
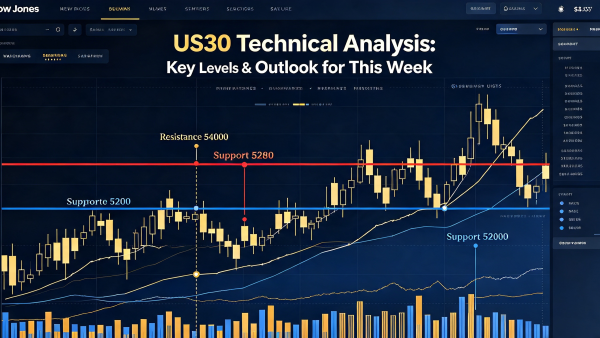
Key Trading Levels to Watch — Week Ahead
Table
| Level Type | Price Zone |
|---|---|
| Immediate Resistance | 53,350 – 53,400 |
| Secondary Resistance | 53,700 – 53,750 (Session High) |
| Critical Resistance | 54,000 – 54,100 (Psychological + Pre-All-Time-High Zone) |
| Immediate Support | 52,950 – 53,000 |
| Secondary Support | 52,500 – 52,600 |
| Critical Support | 52,000 – 52,100 |
- Bullish scenario: Recovering above 53,400 re-opens the 53,700 test and targets new highs.
- Bearish scenario: Closing below 52,950 confirms near-term momentum shift lower, with 52,500 as the next downside objective.
How to Trade the US30 — Practical Guidance
Best Trading Windows
- New York Session (13:30–20:00 UTC) — Peak liquidity, tightest spreads, most reliable price action. This is when the US30 truly “lives.”
- London–NY Overlap (13:30–17:00 UTC) — Highest volume and clearest intraday trends form here.
- Pre-Market / Futures — US30 futures (YM) often set the tone, but execution costs widen outside core hours.
Instruments Available
- CFDs — Most accessible for retail traders; flexible position sizing, no contract expiry.
- Futures (YM) — Institutional-grade; consistent pricing but larger minimum contract size.
- ETFs (DIA) — Best for longer-term exposure; no leverage, simpler holding.
Essential Risk Rules
- Daily limit: Never risk more than 1–2% of capital on a single US30 trade. The index can move 300+ points in a session during news events.
- Stop-loss placement: Avoid obvious round-number levels (53,000 exactly) — place stops slightly beyond confirmed support/resistance to filter out noise.
- News caution: Fed decisions, NFP, and CPI releases can widen spreads and spike volatility. Reduce position size or wait for conditions to settle.
Summary
The US30 stands at 52,981.35, down 0.70% into Thursday’s close — a pullback from near-term highs within a broader uptrend that has carried the Dow above 54,700 at its peak. The index remains in a confirmed bullish structure above key support, but momentum has softened this week. For traders: 53,000 is the immediate line in the sand — holding above favours a bounce; breaking below signals deeper correction.
Whether you trade the US30 intraday or hold for longer trends, remember: the Dow is not just a number — it is the collective confidence of the world’s most influential corporate leaders. Respect the levels, manage your risk, and let the price action guide your decisions.
Disclaimer: This article is for informational purposes only and does not constitute financial advice. Always conduct your own research before trading. Past performance is not indicative of future results.

Leave a Reply